Data tracking – how long does it take?

Last Updated on February 7, 2022 by justin
Whether the goal is increased sales or lead generation, app downloads or a product launch, the first thing we do is set up rigorous data tracking. It can take a month or more in calendar time to set up sufficient tracking, get data, check that we have chosen the right measuring points, and validate that we then actually measure what we want to measure, without any error creeping in. This is what takes time! Troubleshooting and resolving special cases, small errors, new ways as developers or designers create infrastructure and content.
Perfect data tracking does not exist
Vi har fortfarande inte varit med om ett enda fall där datatrackingen har varit uppsatt “perfekt” och det beror på att det ofta behöver göras tolkningar, integrationer och förenklingar och detta tillsammans mellan beslutsfattare, ingenjörer/affärsutvecklare och utvecklare. Detta har blivit så centralt för oss att vi börjar alla samarbeten och projekt med dessa tre steg:
- Tracking (of events that affect major KPIs
- Validation (of data collected from set tracking)
- Visualization (creates dashboards with charts and KPIs of the data collected to ensure that this is what decision makers want and actually need)
In the vast majority of business models, one or more of these steps need to be iterated to achieve the desired result. We at Growth Hackers work our way through these three steps by setting up and visualizing a funnel from traffic to the product / service / website to the purchase / sign-up / contact form.
Example tracking e-commerce
- Traffic to the website
- Traffic to product pages
- Number of visitors who added a product to the shopping cart
- Number of visitors who have started checking out
- Number of visitors who filled in card details
- Number of purchases
Exempel tracking SaaS
- Traffic to the website
- Traffic to product pages
- Number filled in contact form
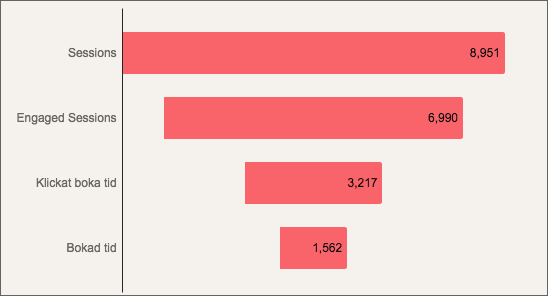
Example Dashboard
Example of what a Dashboard might look like
But I want to work with growth – not data tracking …
Honestly, it happens quite often that customers start to screw up and wonder “when will we see effect” (replace effect with appropriate actual effect such as traffic, leads, revenue, new users, etc.). But without being able to follow up (and trust the data you collect) you can not be sure of the result. It is precisely because we place such a focus on data tracking that the growth curve even has an opportunity to be addressed and optimized in a structured way. This is one of the few things that is really hard to splurge on. either the data is reliable or it is not (note that I say reliable, this is not accounting, it does not have to be “correct” but usually you actually lack some data but only if you know about it, the data can still be used as a basis for decision).
Data is the world’s most valuable resource. “Data is the new oil,” as Jonathan Taplin, author of the book Move fast and break things, put it.
And data-driven companies, really data-driven companies, need to have an absolutely solid foundation to stand on if they are to be able to make decisions based on their collected data. Poorly set up data tracking can be extremely costly in the long run (then we do not mean technical cost but no insight).
A fictional example
For example, let’s say you have a sign-up form on your website that you drive traffic to from Facebook. Then you want to be able to measure how many new customers are coming. But it is not enough you also want to know from which channel but also which campaign from e.g. your Facebook advertising.
If you put Google Analytics and / or Facebook’s tracking pixels on the form page, it’s solved. Unfortunately, you probably do not measure what you want to measure.
You absolutely measure how many people come in via your Facebook ads, but what your measurement value shows are both users who fill in and submit the form, and users who do not fill in the form, it is also not certain that you can differentiate from what campaign on Facebook they come from without just coming from there.
(What you want to do instead is of course to put the tracking pixel on the “Thank you” page that the user sees after he completes his sign-up and use UTM parameters in your ads).
It is easy not to notice errors
If you have made a mistake in this example, you will get the wrong data served to you. If you e.g. pays SEK 100,000 for the traffic, and sees that you receive 10,000 new sign-ups, then you quickly calculate that your Cost Per Acquisition (CPA) is SEK 10. But if, let’s say, half of the visitors to the form do not actually complete their signup, but instead drop out, then in reality you have only gained 5,000 new customers, and your cost per acquisition is instead SEK 20.
If this is only a small part of your total number of visitors, then the chances are quite high that you will not notice the error. So year in and year out, you will pay twice as much as you think for your traffic. And make business decisions accordingly. And all because of a single error measurement, or misinterpretation, when you set up the tracking.
Small mistakes like these are actually more common than you might think. Because it actually looks right; it looks like it is delivering.
Finally …
Tracking is something that is highly vivid, so it is not only important to get it right from the start, but also to review it periodically so it continues to be right and relevant. Which tools you use is less important and buying yourself free with an expensive tool or a one-time investment instead of investing in building skills will always be a worse investment in the long run. The important thing is that you have a solid foundation to stand on. This is when you can achieve profits with data.
If this interests you, check it out below:
- Example of a dashboard
- Do you want help with tracking? Here we explain how we can help you with data tracking and you can contact us
- GDPR affects what you can collect and how. Read more about it here