Growth Analysis
Learn to analyze growth with growth rates, gap analysis and benchmarking. Methods for identifying growth opportunities and bottlenecks.
Growth Analysis: Identifying Growth Opportunities and Bottlenecks
Growth analysis is the process of systematically evaluating a company's growth by measuring growth rates, comparing against benchmarks and identifying where the biggest opportunities and bottlenecks exist. It is a fundamental competence for every growth-focused team and the foundation for making data-driven decisions about where resources should be allocated.
Growth Rates and Key Metrics
The most fundamental measure in growth analysis is the growth rate, expressed as a percentage change over a given time period. The most common variants are:
- MoM (Month-over-Month): Monthly growth. Good for capturing short-term trends and seasonal effects.
- QoQ (Quarter-over-Quarter): Quarterly growth. Provides a more stable picture by smoothing out monthly variation.
- YoY (Year-over-Year): Annual growth. The most important metric for comparing against seasonal effects and understanding long-term development.
- CAGR (Compound Annual Growth Rate): Useful for comparing growth across different time periods on an equal footing.
Choose the metric that matches your business cycle. SaaS companies often track MoM and ARR growth, while e-commerce businesses with strong seasonal effects should focus on YoY comparisons.
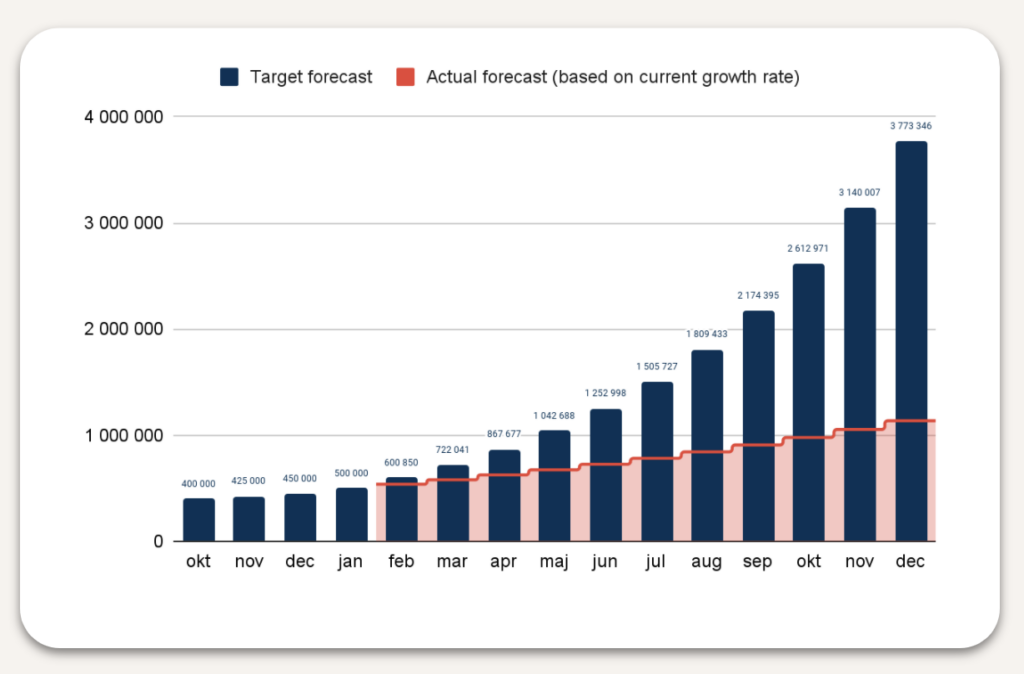
Average Growth Rate
By calculating your average growth rate based on historical data, you can see your current trajectory and compare it against your target.

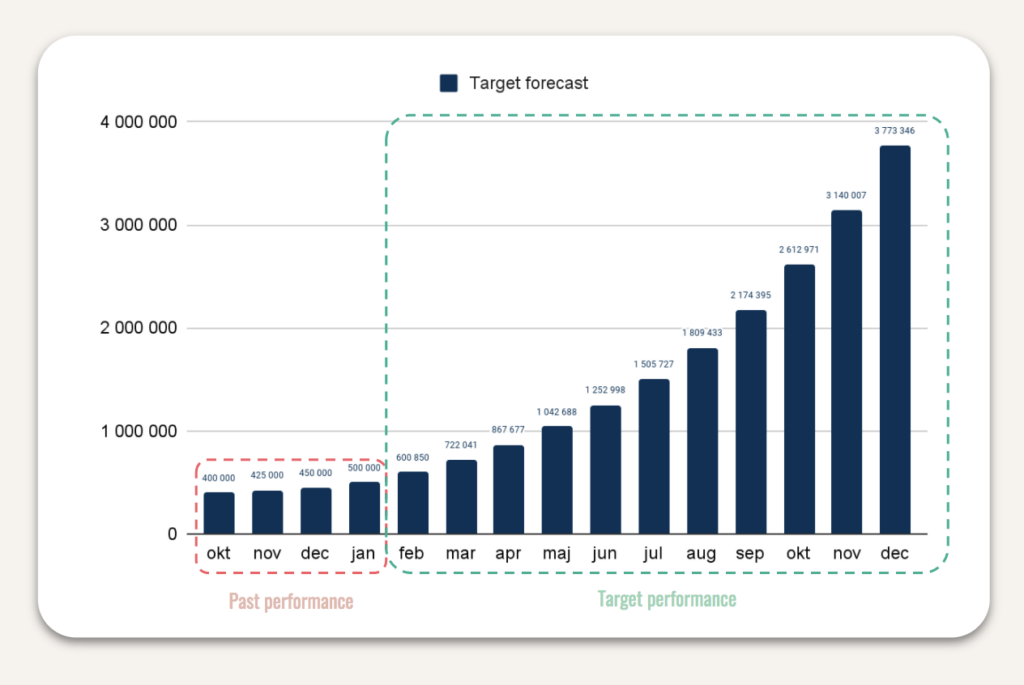
Target Growth Rate
With your annual target and current position, you can calculate the monthly growth rate needed to reach your goal.
Gap Analysis: Finding the Distance to Your Goal
Gap analysis is about quantifying the difference between where you are today and where you want to be. The process begins with defining a clear goal, such as a revenue level, number of customers or conversion rate. You then measure your current position and calculate the gap.
The interesting part is not just the size of the gap but where it occurs. By breaking down the gap into sub-factors, you can identify exactly which areas need improvement. If your revenue gap is caused by low conversion rate rather than low traffic, you should focus on conversion optimization instead of increasing your ad budget.
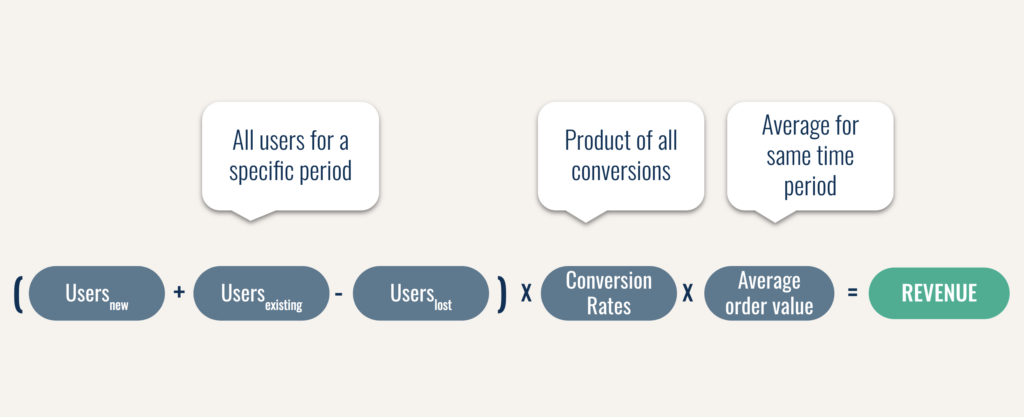
Growth Formula / System
A growth formula breaks down your growth into its components: from visitors to customers and revenue. By visualizing each step of the user journey, you can identify where the biggest improvement opportunities exist.
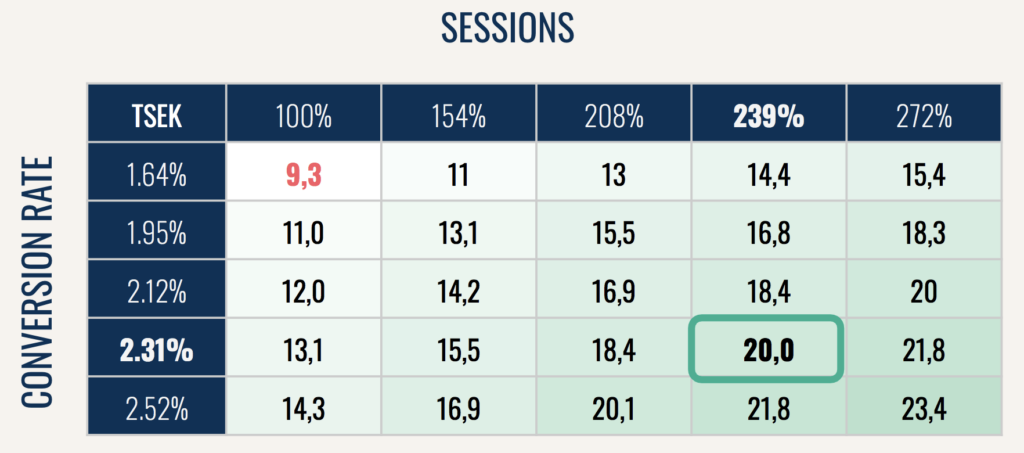
Sensitivity Analysis
A sensitivity analysis shows how changes in individual parameters affect your end goal. By simulating different scenarios, you can identify which parameters have the greatest leverage and where you should focus your efforts.
Benchmarking: Comparing Against the Right Reference Points
Benchmarking means comparing your growth metrics against relevant reference points. These can be industry averages, competitors or your own historical results. Effective benchmarking requires comparing apples to apples: the same measurement period, the same definitions and comparable company sizes.
Common benchmarks to use include conversion rate per channel, customer acquisition cost (CAC), lifetime value (LTV), churn rate and time to conversion. By having clear benchmarks, you can quickly identify whether a result is good or bad relative to the market.
Identifying Growth Opportunities
With data from growth rates, gap analysis and benchmarking, you can now identify the most promising growth opportunities. Look for:
- Channels with high conversion rate but low volume, where scaling can deliver quick results.
- Steps in the funnel with unusually high dropout, where conversion potential exists.
- Segments with higher LTV or lower CAC, where focused investment can pay off.
- Benchmarks where you fall below the industry average, where improvement potential exists.
Prioritize opportunities based on potential impact and feasibility. A North Star Metric helps you stay focused on the most important growth driver.
Tools and Methods
Effective growth analysis requires the right tools. GA4, Mixpanel or Amplitude provide behavioral data. CRM systems like HubSpot or Salesforce provide customer data. Dashboards in Looker Studio or Tableau visualize the trends. Combine data sources for a complete picture and avoid making decisions based on isolated data points.
Growth analysis should be an ongoing process, not a one-time exercise. Integrate it into your growth sessions and use the insights to drive your experiment agenda forward.
Frequently Asked Questions
How often should we conduct a growth analysis?
Conduct a comprehensive growth analysis quarterly and track your most important growth metrics weekly or monthly. Fast-moving businesses like e-commerce may need daily monitoring of key metrics.
What are the most common mistakes in growth analysis?
The three most common mistakes are focusing on vanity metrics instead of business-driving measures, failing to break down aggregated numbers into sub-factors and comparing yourself against irrelevant benchmarks. Ensure your analysis always ties back to concrete growth opportunities.